
Detailed data allows marketers to create precise segments and a 360° view of customers to target them more granularly and connect with them on a deeper level.
To be able to leverage your data assets, it is critical to have access to a depth and breadth of accurate and reliable data.
There are many data collection platforms and marketing tools out there that help marketers access detailed analytics about their customers. Still, when it comes to deciding which one to use, a deep understanding of their processes is necessary.
Mixpanel is one such tool equipped with the ability to collect and analyze user data in real-time. Marketers can use it to understand their customers, spot products’ usage trends, predict results, and make informed decisions.
In this tutorial, we take the reader through the steps needed to make the most out of Mixpanel. We will not only explore its feasibility for use in data collection but also how you can go about accomplishing your goals with this platform.
What type of data does Mixpanel collect?
Data collected for analyses is acquired from both digital apps and websites businesses may use for product monetization.
The data model structure employed by Mixpanel consists of a modular combination of two different types of data: event and profile, where event stands for meaningful user action and profile for individual user information.
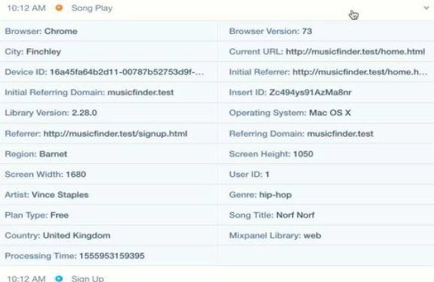
Below is an example of the activity feed on Mixpanel, which automatically displays events that are set to be tracked—song play, sign up, and sign up page view, in this case:
 To know more about a tracked event’s specifics at any point in time, we look at its event properties.
Event properties for any event can be viewed by simply clicking on the event in your activity feed.
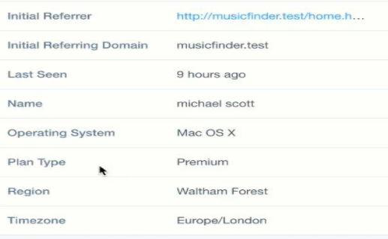
On the other hand, individual profiles aggregate every piece of current information about individual users into one place. An example of an individual profile’s properties can be seen below.
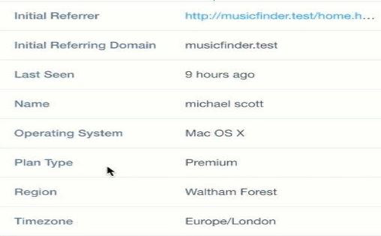
Although the values of these two properties may appear similar at first glance, there is one big difference between them: historical versus up-to-date data. Individual profile properties are constantly updated to reflect users’ current behaviors, whereas the event properties stay the same throughout. That’s because event properties represent the history of all user actions to keep a record of each actual event. In contrast, profile properties provide details about the most recent state of a user.
For example, if a user signed up for a free account, the event properties would remain the same.

But later, if they upgrade to a premium account, these changes will be reflected in the profile properties.
How is data sent to Mixpanel?
Tracking code installation into the application’s source code is required for collecting data—a process often referred to as “implementation.”
It would look something like this:

To understand how this works, let's say that you've added a Mixpanel code to the "Sign Up" button on your website. Every time a user signs up on your website, it gets triggered, and data is sent to Mixpanel.
Implementation is one of the most critical stages of the process; how well you can collect and analyze data through Mixpanel depends on how effectively the tool has been implemented. If you are reducing browser tag bloat by connecting it through a customer data integration tool, no new snippet is needed; just connect Mixpanel through the library of integrations and begin sending data immediately.
To avoid drowning in a sea of irrelevant data, users can customize their implementation of Mixpanel to fit their needs. Users can also choose which data must be collected when planning their implementation process (if using customer data integration tool, this part will already be completed).
Of course, as the breadth of needs within an organization evolves, the implementation process can be updated as needed.
How is data analyzed in Mixpanel?
Data is analyzed using standard metrics, such as the number of active users as well as conversion, drop-off, and retention rates. Regardless of what products you sell, where your company is located, or what industry you are in, it is crucial to analyze these metrics.
- Active users - An individual who has performed a specific action once or multiple times. Businesses can set the criteria for what constitutes an active user, depending on their product.
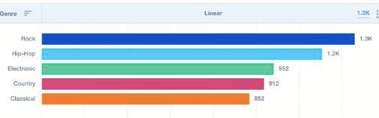
Examining the active users is important because it allows you to analyze data for customer behavior patterns, market trends, and other potentially valuable information through the Mixpanel Insights report, as illustrated in the screenshot below.
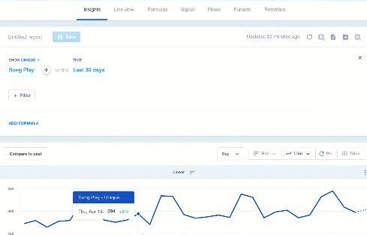
As you can see in this screenshot, after selecting the event type and time under the category of unique users, the insight report shows you a simple line graph representing changes and fluctuations in trends and patterns, allowing you to compare growth rates over the past cycles.
- Conversion and drop-off rates– Conversion and drop-off rates highlight key data related to user engagement. In terms of user flow (e.g., a signup process funnel), they are exact opposites of one another. The conversion rate of a particular action is the percentage of users who engaged in the action. In contrast, the drop-off rate represents the percentage of users who failed to engage in a given action.
In the Mixpanel Funnels report, you can define the points of interest to better understand the users visiting your site, the actions they are taking, and their path to conversion.
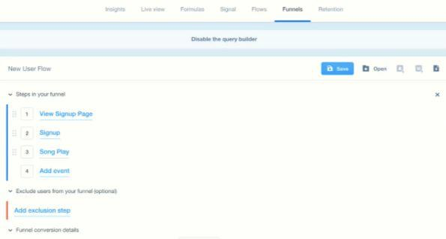
In the example above, view signup page, signup, and song play were added as steps in user flow, but you can easily add any events that you want to track by selecting add event.
Mixpanel allows you to view this data in meaningful graph forms, as exemplified below.
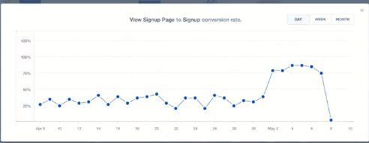
A sudden spike in the conversion rates right after you make changes indicates that the approach works.
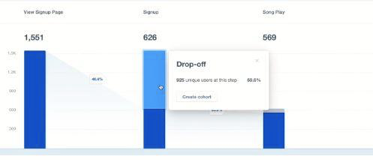
To put things into perspective: in this screenshot, you can see there was a more significant audience drop-off between the first and second steps of user flow. Based on this analysis, you can implement a new strategy or intervention that has been shown to be effective in increasing the number of users following the customer journey through to the end.
The platform’s filtering and segmentation capabilities add even more depth to user data management.
- Retention rates - A measure of performance providing data on customer satisfaction. (A high retention rate is a sign that the business is capturing value.)
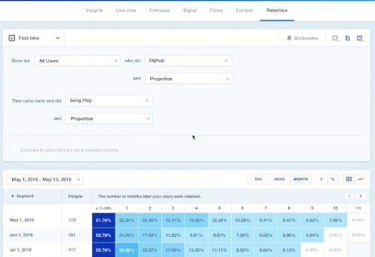
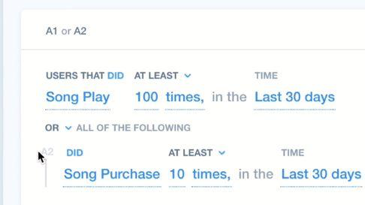
In this example, selecting retention and defining specific parameters--such as date, signup, and retention timeframe--generates vital information on how many customers have been retained from signup to churn.
How does Mixpanel capitalize on the data?
The substantial value of utilizing insights derived from data analysis is that it enables businesses to make informed decisions about how to fuel their objectives.
The tools offered by Mixpanel provide a breadth of opportunities that helps businesses acquire, engage, and retain a loyal customer base.
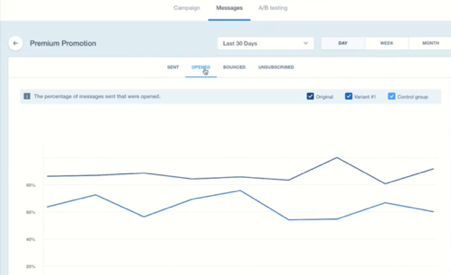
When it comes to communicating with customers, timing is of the essence. Whether the intent is to direct and encourage customers to take a specific action or increase customer satisfaction, Mixpanel’s messaging tool can be incredibly useful.

It enables businesses to target, acquire, engage, and retain a loyal customer base; more importantly, it allows companies to measure their messaging effectiveness, as illustrated in the screenshot below.
Features for advanced users
- Fully adaptive user interface - Visually organize your metrics and data analytics into stunning, easy-to-read reports that can be shared effortlessly through Slack integration. This feature is particularly important in today’s remote work landscape.
- Easily synchronize data to warehouses - Sync user data to leading cloud data warehouses--like Amazon, Google, and Microsoft--and use Cloud Import to intelligently load and view all event data. All you need is to make changes to the configuration of data warehouses and use Mixpanel’s export API to establish a data pipeline.
- Improved query speed - Dig deeper into large sets of data, running a full range of analyses in as little as 0.8 seconds—nearly a 50% reduction of the average query time.
- User behavior-based cohorts – Uncover techniques to improve conversion rates through split-test marketing.
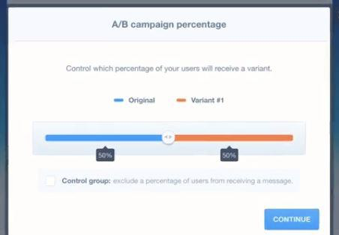
Using behavioral segmentation alongside specific properties defined by you, Mixpanel will provide you with data-driven, recommended actions to achieve your predefined outcomes.
- Unlimited events tracking for no additional cost - Use query-time sampling to store and activate billions of data points in real-time. Mixpanel’s Monthly Tracked Users (MTU) pricing model means that you can better estimate and manage data point collection costs.
- Use Mixpanel in conjunction with other full-fledged messaging tools - Integrate with top messaging tools--such as Airship, OneSignal, and Iterable--to add points of contact to the user journey and maximize user engagement.
Customer data integration
The customer data that powers Mixpanel is an invaluable resource. When used intelligently alongside an effective customer data infrastructure platform, like MetaRouter, it empowers marketing teams to optimize their current strategies and unearth new outreach opportunities. Utilizing the integrations within Mixpanel not only ensures that customer data is uniformly available across channels–it also gives companies more ways to leverage this data.
Pricing options and expected ROI
Mixpanel has three pricing tiers to accommodate different levels of organizations.
- The Starter tier--which allows up to 1,000 monthly tracked users and stores up to 90 days of data history--is free.
- The Growth tier--which offers up to 25,000 monthly tracked users and has no cap on data history, begins at $24 per month for every 1,000 monthly tracked users.
- The Enterprise tier—which contains all of the Growth tier tools and unlocks professional services for clients—has custom pricing.
It is no secret that investing in a business is a surefire way to witness its growth, and Mixpanel is no different. According to a 2018 Total Economic Impact Report by Forrester Consulting, Mixpanel customers who used the SaaS product for three years averaged a whopping 298 percent ROI. In other words, Mixpanel is an investment that pays for itself – and then some.
Concluding Thoughts
The world of digital marketing is increasingly competitive, and organizations that want to both grow and maintain their edge have to constantly find ways to make their marketing efforts stand out.
Mixpanel is an analytics platform that grants teams the ability to intelligently track web and mobile events to understand customer behavior better. Powerful integrations with tools like Airship, Convert, and HelpScout means that teams can use customer data toward audience engagement, A/B testing, customer success, and much more.
Three pricing tiers, including a free plan, grant all levels of organizations—from fledgling startups to large enterprises—access to its benefits. A pricing model that charges based on monthly tracked users (MTUs) gives companies the flexibility to calculate costs based on their exact needs at any point in the business cycle.
While value is certainly an important factor in decision making, companies ultimately want to see results after investing in a new service. With accolades like the 2019 Customers’ Choice for Web & Mobile App Analytics, offices located in the United States, Asia, and Europe, and an impressive track record of increasing ROIs, Mixpanel is ready to serve—and deliver.
Photo by Mika Baumeister on Unsplash